

React Flow Diagram Interactions
The Database Schema section features an interactive React Flow diagram that allows you to visualize and explore your database structure dynamically. This visual tool is essential for understanding complex data relationships and communicating the system architecture to stakeholders.
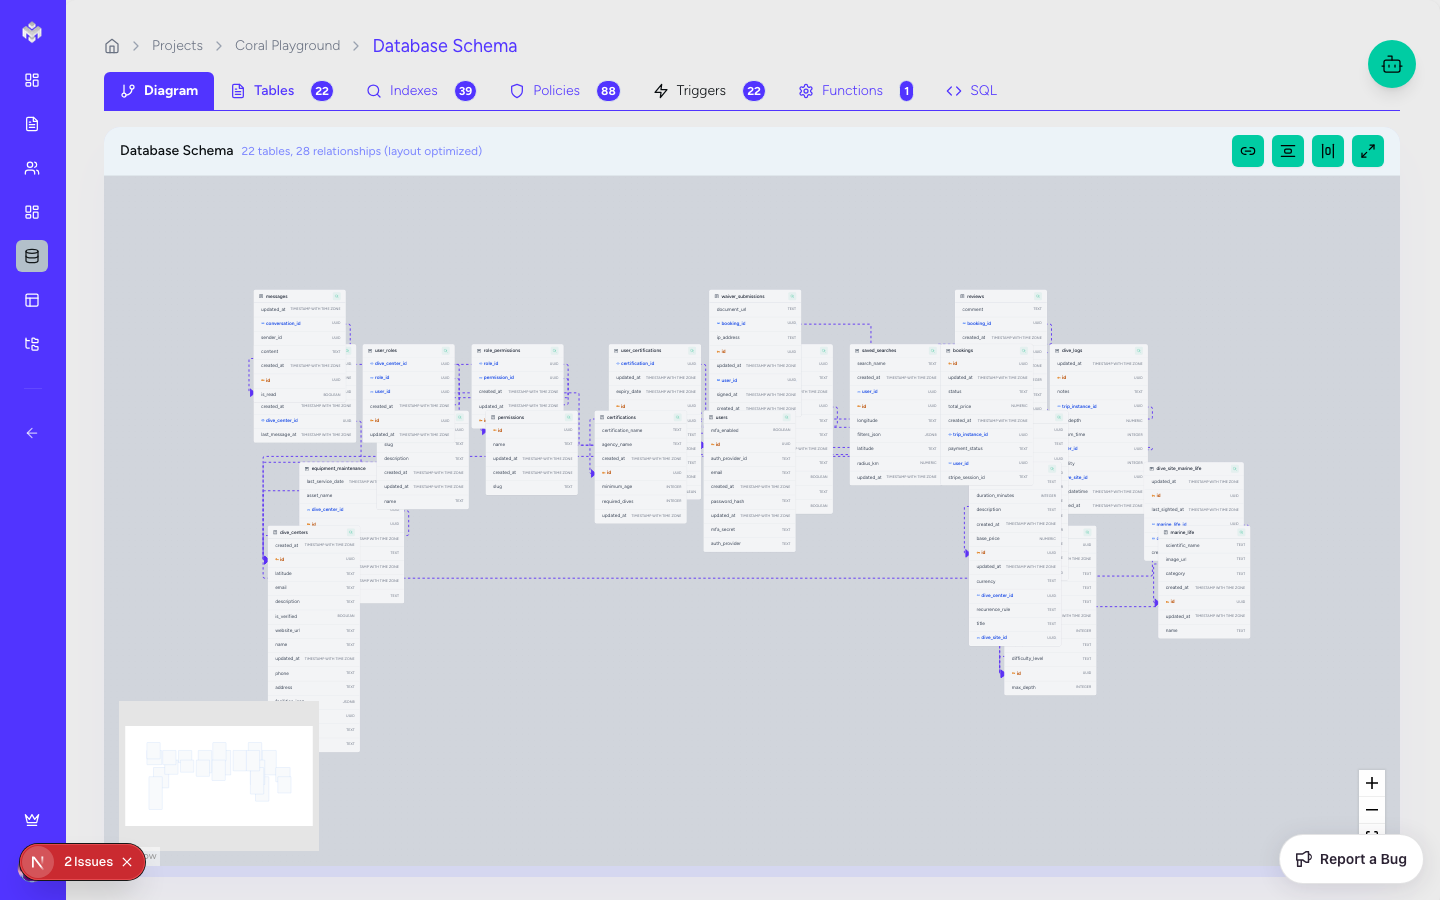
Diagram Navigation
Basic Controls
Pan: Click and drag on the background to move around the workspace.
Zoom: Use your mouse wheel or the +/- controls in the sidebar to adjust your view.
Fit to Screen: Click the "Fit to Screen" icon to automatically center and zoom the diagram so all tables are visible.
Minimap: A small window in the corner provides a high-level overview, allowing you to quickly jump to different sections of large schemas.
Navigation Shortcuts
Space + Drag: Quick-pan across the diagram.
Ctrl + Mouse Wheel: Fine-grained zoom control.
Double-Click Table: Automatically focus and zoom in on a specific table.
Node (Table) Interactions
Each database table is represented as an interactive node in the flow.
Table Components
Header: Displays the table name and a color-coded icon representing its category.
Column List: Shows every field with its data type and key status (PK/FK).
Selection State: Clicking a table highlights it and isolates its direct relationship lines, making it easier to trace data flows in complex models.
Node Actions
Drag & Drop: Manually rearrange tables to create a custom layout that makes sense for your project.
Context Menu: Right-click a table to access quick actions like:
Edit Table: Open the full table editor.
Add Column: Quickly add a new field.
Delete: Remove the table (with a safety confirmation).
Relationship (Edge) Interactions
The lines connecting tables (Edges) represent foreign key constraints.
Visual Cues
Directionality: Lines flow from the child table (FK) to the parent table (PK).
Hover Highlighting: Hovering over a relationship line will bold it and highlight the specific columns involved in the join.
Labels: Relationship types (1:1, 1:N) are often indicated via labels on the connection lines.
Managing Connections
Edit Relationship: Click on an edge to view and modify the constraint properties, such as Cascade Rules or the linked columns.
Layout & Organization
Auto-Layout Algorithms
Vibemap includes several algorithms to help organize your schema:
Hierarchical: Best for showing data flow from top-level entities down to details.
Force-Directed: Spreads tables out evenly, useful for identifying clusters of related data.
Snap to Grid: Helps maintain a clean, professional look by aligning tables to a consistent grid.
Manual Refinement
Your custom positions are saved to your project session, so your carefully organized diagram will remain exactly how you left it.
Export & Sharing
High-Resolution Export
Capture your architecture for documentation or presentations:
PNG/JPG: Export the current view as a high-quality raster image.
SVG: Export a scalable vector version, perfect for large-scale printing or high-res documentation.
Crop to Selection: Export only the currently selected tables.
Documentation Integration
Vibemap's visual diagrams are automatically included in the Technical Documentation export, ensuring your project's visual and textual specs are always in sync.
Last updated
Was this helpful?